
Welcome to Dry Tortugas National Park
Welcome to the Dry Tortugas National Park Information Guide.
Here you will find all you need to know about the natural history of the park.
Learn about the geology, trees, mammals, birds, or other plants and wildlife of the area.
Dry Tortugas National Park is located 68 Nautical miles west of Key West, Florida
The closest major airport is Key West International at 68 miles east of the park.
Drive South on Highway 1 to Key West and take a boat, ferry or plane from there or one of the Lower Keys.
Boat, ferry or seaplane provide the only access to the Park. Several boat and air taxi services offer trips to the Dry Tortugas from Key West and the Lower Keys, as well as from the Naple and Fort Myers areas of Southwest Florida. Specific information about these services may be obtained from the local chambers of commerce. You may also visit by personal boat but they must be fully self-sufficient.
General Information
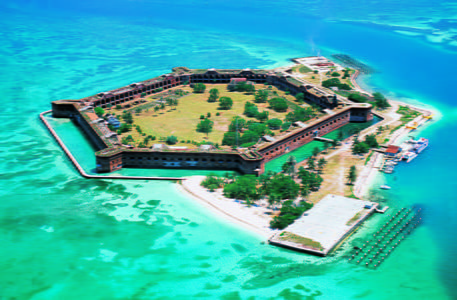
Almost 70 miles / 112.9 km west of Key West lies a cluster of seven coral reefs called the Dry Tortugas. These reefs along with surrounding shoals and waters make up Dry Tortugas National Park. Known for its famous bird and marine life, and its legends of pirates and sunken gold. Dry Tortugas National Park includes the largest of the 19th century American coastal forts.
Establishment the Dry Tortugas National Park
Fort Jefferson National Monument was established to protect historic Fort Jefferson. The area was changed to Dry Tortugas National Park in 1992, to provide additional management protection of the area’s subtropical marine system, including coral reefs, fisheries, nesting birds, sea turtles, and other wildlife.
Fort Jefferson National Monument was established by Presidential Proclamation on January 04, 1935 (19 Stat. 3430).
The park name was changed by Congress to Dry Tortugas National Park in October 1992 (Public Law 102-525).
This new law provided for potential transfer of Loggerhead Key from the U.S. Coast Guard to the National Park Service.
Size, Visitation and Budget
Acreage – as of September 23, 2000
Federal Land – 61,481.22
Non-Federal Land – 3,220.00
Gross Area Acres – 64,701.22
Visitation
Total Recreation Visits for Fiscal Year 2003: 74,576
Total Recreation Visits for Fiscal Year 2002: 78,751
Total Recreation Visits for Fiscal Year 2001: 80,166
Total Recreation Visits for Fiscal Year 1999: 74,186
Budget
Fiscal Year 2004 Annual Budget: $ 1,276,000
Fiscal Year 2003 Annual Budget: $ 1,286,000
Fiscal Year 2002 Annual Budget: $ 1,300,000
Fiscal Year 2001 Annual Budget: $ 1,293,000
The best time to visit is November through April. The keys are hot and humid during the wet summer season and the insects bite and swarm. Be aware that seas are rough from October through January. Always wear sunscreen whenever you visit. Peak visitation is in April.
You might find that the waters are relatively calmer during the months of April-June. With lush flora and fauna to see in the clear waters, going for a vacation to enjoy water sports such as Scuba Diving, jet skiing, boating and more might be what your family needs during the summer holidays. So, with a visit to the Dry Tortugas National Park, a few water sports to enjoy nearby, and good seafood to eat, you could have an all-inclusive family vacation.
History of Dry Tortugas National Park
First named The Turtles, Las Tortugas, by Spanish Explorer Ponce de Leon in 1513, these reefs soon read “Dry Tortugas” on mariners charts to show they had no fresh water. In 1825 a lighthouse was built on Garden Key to warn sailors of rocky shoals; in 1856 the present light on Logger Key was built. By 1829 the United States knew it could control navigation to the Gulf of Mexico and protect Atlantic-bound Mississippi River trade by fortifying the Tortugas. Fort Jefferson’s construction began on Garden Key in 1846 and continued for 30 years but was never finished.
During the Civil War the fort was a Union military prison for captured deserters. It also held 4 men convicted of complicity in President Abraham Lincoln’s assassination in 1865. The Army abandoned Fort Jefferson in 1874, and in 1908 the area became a wildlife refuge to protect the sooty tern rookery from egg collectors. President Franklin D. Roosevelt proclaimed Fort Jefferson National Monument in 1935. The Monument was redesignated on October 25, 1992 as Dry Tortugas National Park to protect both historical and natural features. Not least among the natural treasures are its namesakes, the endangered green sea turtle and the threatened loggerhead turtle.
Boating
Private boaters have a prime opportunity to visit the fort. Nautical charts for the route can be purchased at marinas and boating supply outlets in Key West. Information can be obtained in Key West from the U.S. Coast Guard station, the Chamber of Commerce, and the Charter Boat Association. Boaters should be aware of the possibility of extreme rough seas.
If you visit using your personal boat, please bring at least two anchors and NOAA chart 11438. Overnight anchoring is limited to within one mile of Garden Key; there are no overnight anchoring buoys. Dockage at Garden Key is limited to two hours daily, sunrise to sunset.
Docking facilities are provided for park visitors and park operations. Load, unload, and moor vessels only where designated on the public dock. Moor private vessels no more than 2 hours between sunrise and sundown; overnight mooring to docks or piers is prohibited. The park superientendent may waive these regulations in emergencies that threaten life or property.
Seaplane approaches, landings, and takeoffs are limited to within 1 mile of the fort. Moor seaplanes only in the designated area at Garden Key.
Dumping or throwing overboard bottles, cans, paper, or other trash on park grounds or in the water is prohibited. It is illegal to pump holding tanks into park waters. Warning: Park waters over shallow coral heads and reefs are protected and may cause severe damage to boats and equipment if stuck. Use caution in all park areas.
Boat Tours, Diving and Park Tours
Camping
Camping is permitted on Garden Kay only in a small number of primitive camp sites that are available on a first-come, first served basis. Groups of 10 or more must obtain a special permit in advance. Camping is $3.00 per person per night (exact change required).
Fees – Entrance Fee and Camping Fee
The Entrance Fee for Dry Tortugas National Park is: $ 5.00 (for anyone 17 and older for a 7 day pass).
The Camping Fee is $ 3.00 per person per night (exact change required).
National Park Passes
- National Parks Pass (good 1 year from date of purchase) $ 50.00 (valid in all Natl Parks)
- Golden Eagle Pass (good 1 year from date of purchase) $ 15.00 (valid in all Natl Parks & Fed Rec Areas)
- Golden Access Pass (blind or permanently disabled) Free (Lifetime – valid in all Natl Parks)
- Golden Age Pass (1 time fee – for those 62+) $ 10.00 (Lifetime – valid in all Natl Parks)
Fishing
A Florida salt water fishing license is required to fish. Personal watercraft, i.e. jet skis, are not permitted.
Food and Supplies
Supplies are available in Key West and other local communities of Stock Island, Big Coppitt Key, Summerland Key and Marathon.
Hiking
Fort Jefferson is open during daylight hours and there is a self-guiding trail that interprets the history of human presence in the Dry Tortugas while leading visitors through the fort. Loggerhead Key is open during the day only. All buildings and structures are closed to entry unless you are accompanied by a park employee.
Lodging
Other overnight accommodations are available in Key West and other local communities of Stock Island, Big Coppitt Key, Summerland Key and Marathon. Check the Lodging Page for details.
Natural and Cultural Features
Do not disturb shells, corals, seafans, tropical fish, spiny lobster, and turtles and their nests. Dead shells above high water line may be collected, but all coral, living and dead, is protected from collection. Shipwrecks and their cargo and all historic artifacts in the park are protected by law. Commercial fishing and spearfishing are prohibited; so is taking of conch or lobster.
Nesting Closures
Bush Key is reserved for birds only in the February through September nesting season when disturbance may cause death for many young birds. Hospital and Long Keys are closed all year long.
Programs / Activities
Interpretive exhibits, a picnic area, self-guiding tours, Ranger-led activities, bird and wildlife watching, picnicking, salt water sport fishing, snorkeling, swimming and scuba diving are some of the activities available.
Visitor Center
The visitor center is located on Garden Key and is open all year from 8:00 am to 5:00 pm. There is a slide program about the islands as well as exhibits. Ranger lead nature walks are also provided. You can also borrow snorkel equipment. Divers must bring their own gear. There is no food or fresh water. You must provide your own. See the Calendar Page for details.
Weather of Dry Tortugas National Park
The best time to visit is November through April.
The Keys are hot and humid during the wet summer season and the insects bite and swarm.
Be aware that seas are rough from October through January.
Always wear sun screen whenever you visit.